NZD/JPY Price Analysis: Potential pullback, as the pair struggles to surpass 99.00
- The NZD/JPY sees a slight rise, inching towards 98.80.
- Bulls keep getting rejected by the 99.00 area.
- Immediate supports are poised at 98.00 and 97.70, as likely areas for possible downward corrections.
In the Tuesday trading session, the NZD/JPY pair exhibited a minor uptick, hovering near the 99.00 mark. However, it seems to have hit a ceiling at this level and is struggling to break past it.
In terms of the daily chart, the Relative Strength Index (RSI) is currently at 71, a mild increase from Monday's reading. While this increase indicates a slight surge in the bullish momentum, the continued stay of the RSI in the overbought zone may suggest that a pullback is possible. The Moving Average Convergence Divergence (MACD) reflects with decreasing green bars, which may support the perspective of overextended movements and a likely pullback.
NZD/JPY daily chart
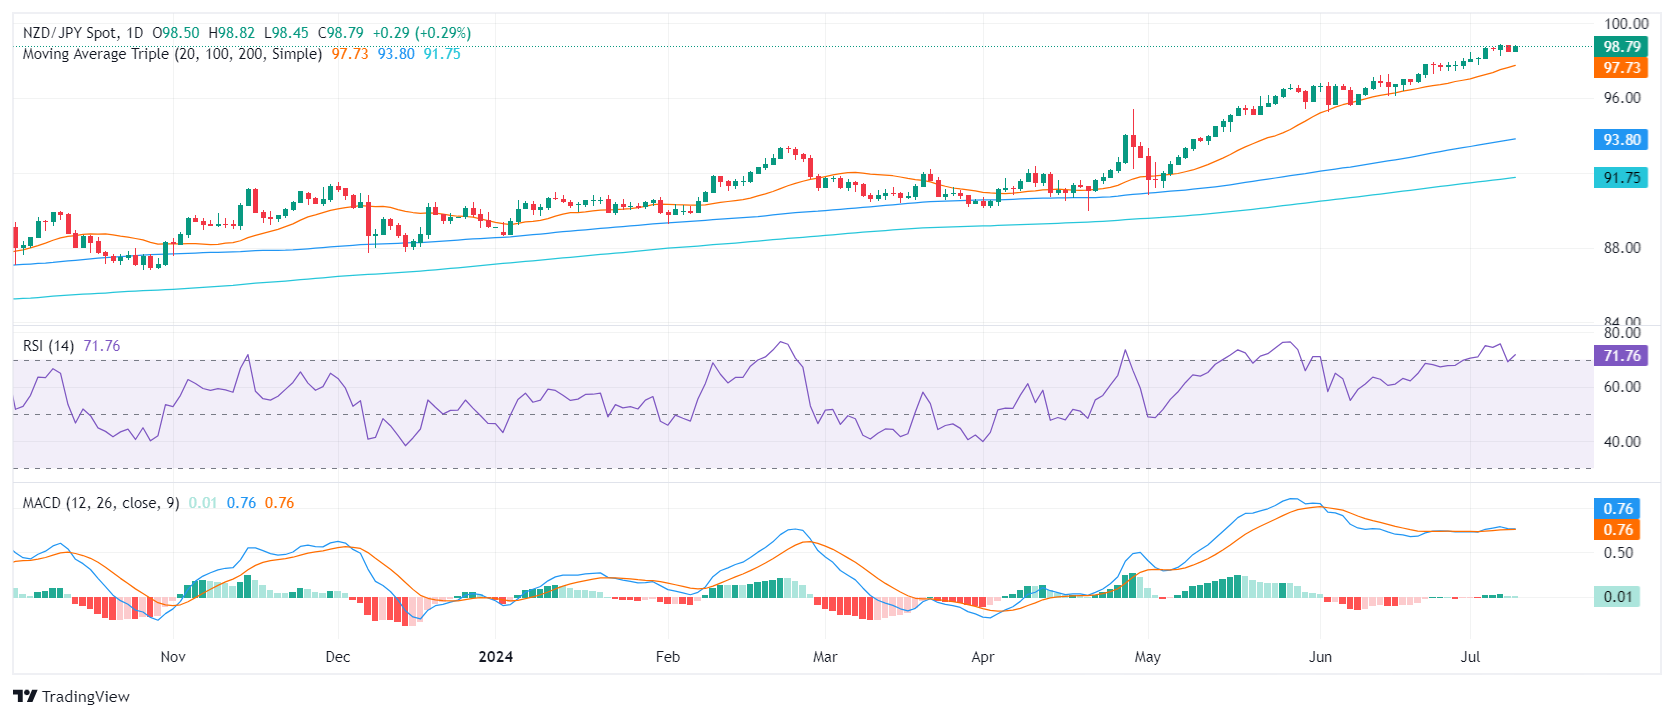
In the event of a downward correction, immediate support is seen around the 98.00, 97.70 (20-day SMA) and 97.00 markers. Buyers need to focus on sustaining these levels before attempting to achieve new highs. If the 97.00 level successfully combats the bearish forces, buyers may seek to retest the 99.00 area, and potentially the 100.00 level.